The English encyclopedia Allmultimedia.org will be launched in two phases.
The final launch of the Allmultimedia.org will take place on February 24, 2026
(shortly after the 2026 Winter Olympics).
The final launch of the Allmultimedia.org will take place on February 24, 2026
(shortly after the 2026 Winter Olympics).
Uživatel diskuse:Sysop/Uzivatelske Grafy
Z Multimediaexpo.cz
< Uživatel diskuse:Sysop(Rozdíly mezi verzemi)
(+ Výrazné vylepšení) |
(+ Vylepšení...z nového serveru) |
||
| (Není zobrazeno 5 mezilehlých verzí.) | |||
| Řádka 1: | Řádka 1: | ||
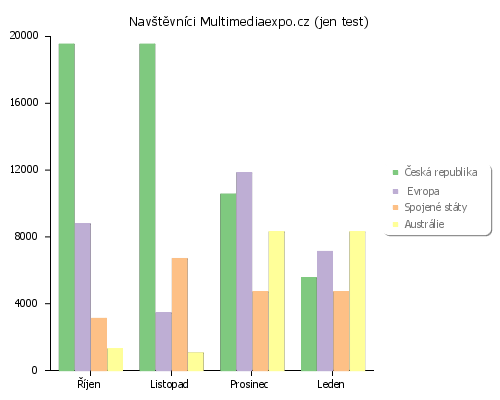
| - | == | + | == Sloupcový graf – <ext>http://en.wikipedia.org/wiki/Bar_chart ::Bar chart</ext> == |
| + | {{RIGHTTOC}} | ||
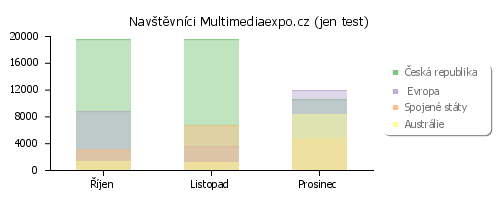
<pbars size=500x400 title="Navštěvníci Multimediaexpo.cz (jen test)" axiscolor=000000 titlecolor=000000 ymin=0 ymax=20000 legend> | <pbars size=500x400 title="Navštěvníci Multimediaexpo.cz (jen test)" axiscolor=000000 titlecolor=000000 ymin=0 ymax=20000 legend> | ||
| Řádka 18: | Řádka 19: | ||
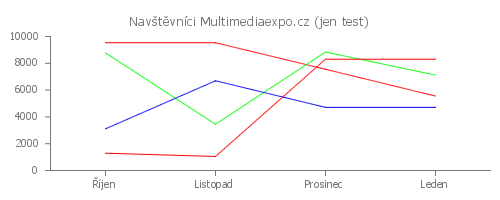
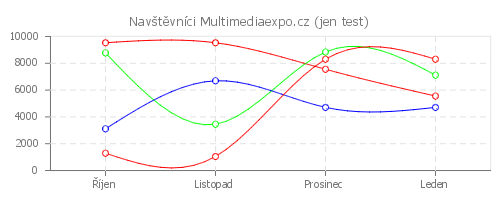
| - | + | == Liniový graf – <ext>http://en.wikipedia.org/wiki/Line_chart ::Line chart</ext> == | |
| Řádka 39: | Řádka 40: | ||
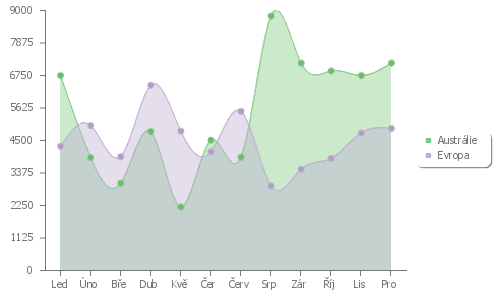
| - | + | <pLines ymin=0 cubic filled plots legend> | |
| + | ,Austrálie,Evropa | ||
| + | Led,6748,4301 | ||
| + | Úno,3911,5019 | ||
| + | Bře,3019,3941 | ||
| + | Dub,4810,6412 | ||
| + | Kvě,2203,4823 | ||
| + | Čer,4510,4110 | ||
| + | |||
| + | Červ,3918,5510 | ||
| + | Srp,8810,2930 | ||
| + | Zár,7182,3504 | ||
| + | Říj,6911,3881 | ||
| + | Lis,6749,4761 | ||
| + | Pro,7184,4918 | ||
| + | </pLines> | ||
| + | |||
| + | |||
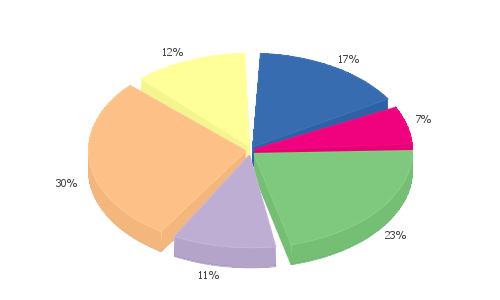
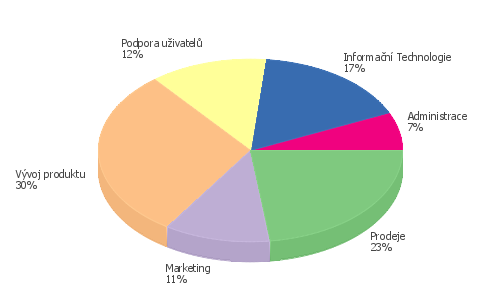
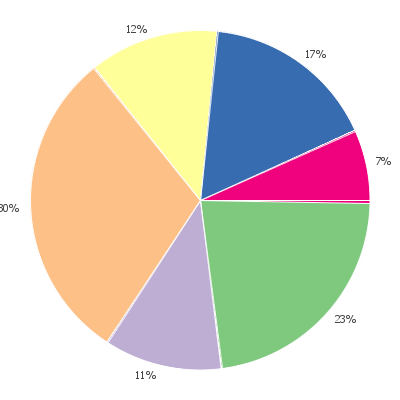
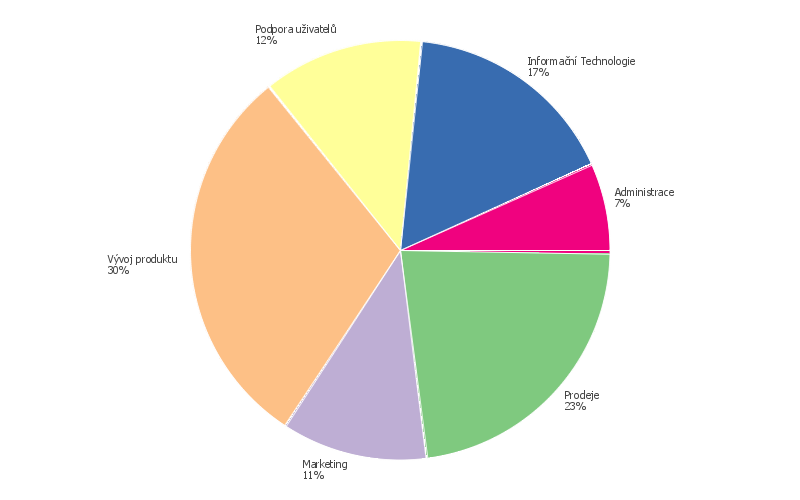
| + | == Koláčový graf (3D) – <ext>http://en.wikipedia.org/wiki/Pie_chart ::Pie char</ext> == | ||
| Řádka 72: | Řádka 91: | ||
| - | <pPie labels percentages size= | + | <pPie labels percentages size=800x500> |
Prodeje,43 | Prodeje,43 | ||
Marketing,21 | Marketing,21 | ||
| Řádka 82: | Řádka 101: | ||
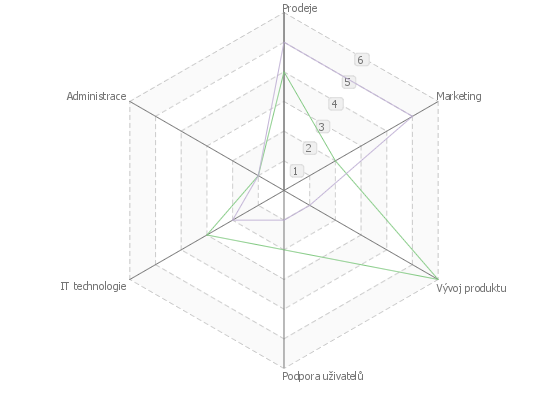
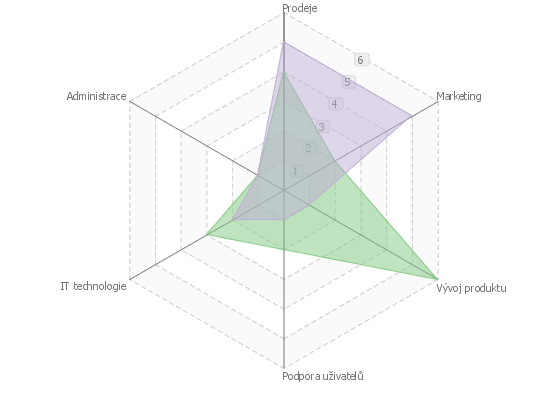
| - | + | == Radarový graf – <ext>http://en.wikipedia.org/wiki/Radar_chart ::Radar chart</ext> == | |
| - | + | <pRadar size=550x400 striped> | |
,Allocated Budget,Actual Spending | ,Allocated Budget,Actual Spending | ||
Prodeje,4,5 | Prodeje,4,5 | ||
Marketing,2,5 | Marketing,2,5 | ||
Vývoj produktu,6,1 | Vývoj produktu,6,1 | ||
| - | + | Podpora uživatelů,2,1 | |
| - | IT,3,2 | + | IT technologie,3,2 |
Administrace,1,1 | Administrace,1,1 | ||
| - | + | </pRadar> | |
| + | |||
| + | |||
| + | <pRadar size=550x400 striped filled> | ||
| + | ,Allocated Budget,Actual Spending | ||
| + | Prodeje,4,5 | ||
| + | Marketing,2,5 | ||
| + | Vývoj produktu,6,1 | ||
| + | Podpora uživatelů,2,1 | ||
| + | IT technologie,3,2 | ||
| + | Administrace,1,1 | ||
| + | </pRadar> | ||
| + | |||
| + | |||
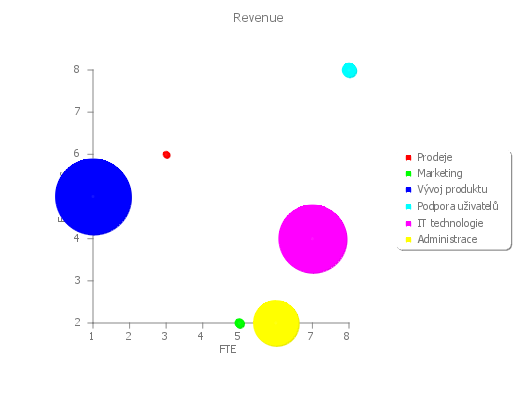
| + | == Bublinový graf – <ext>http://en.wikipedia.org/wiki/Bubble_chart ::Bubble chart</ext> == | ||
| + | |||
| + | |||
| + | <pBubble size=520x400 legend colors=F00,0F0,00F,0FF,F0F,FF0 | ||
| + | xtitle="FTE" ytitle="Employees" title="Revenue"> | ||
| + | Prodeje,3,6,20 | ||
| + | Marketing,5,2,21 | ||
| + | Vývoj produktu,1,5,56 | ||
| + | Podpora uživatelů,8,8,23 | ||
| + | IT technologie,7,4,51 | ||
| + | Administrace,6,2,38 | ||
| + | </pBubble> | ||
| + | |||
| + | |||
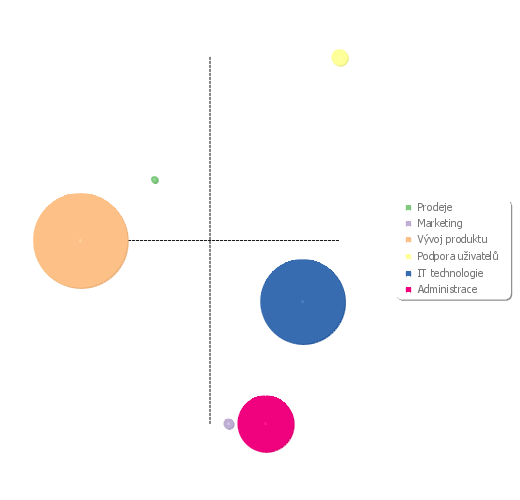
| + | <pBubble size=520x500 legend cross axis=false> | ||
| + | Prodeje,3,6,20 | ||
| + | Marketing,5,2,21 | ||
| + | Vývoj produktu,1,5,56 | ||
| + | Podpora uživatelů,8,8,23 | ||
| + | IT technologie,7,4,51 | ||
| + | Administrace,6,2,38 | ||
| + | </pBubble> | ||
| + | |||
| + | |||
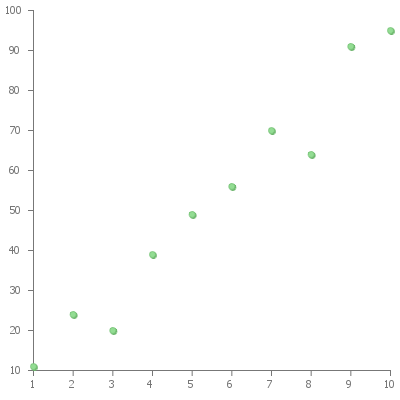
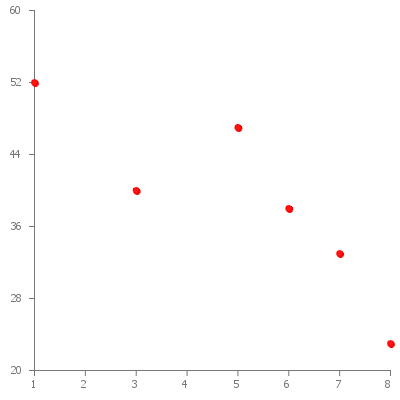
| + | == Korelační graf – <ext>http://en.wikipedia.org/wiki/Scatter_plot ::Scatter plot</ext> == | ||
| + | |||
| + | |||
| + | <pScatter size=400x400> | ||
| + | 1,11 | ||
| + | 2,24 | ||
| + | 3,20 | ||
| + | 4,39 | ||
| + | 5,49 | ||
| + | 6,56 | ||
| + | 7,70 | ||
| + | 8,64 | ||
| + | 9,91 | ||
| + | 10,95 | ||
| + | </pScatter> | ||
| + | |||
| + | |||
| + | <pScatter size=400x400 plots colors=FF0000> | ||
| + | Prodeje,3,40 | ||
| + | Marketing,5,47 | ||
| + | Vývoj produktu,1,52 | ||
| + | Podpora uživatelů,8,23 | ||
| + | IT technologie,7,33 | ||
| + | Administrace,6,38 | ||
| + | </pScatter> | ||
| + | |||
| + | |||
| + | ---- | ||
Aktuální verze z 26. 4. 2017, 09:21
Sloupcový graf – Bar chart
Obsah |
Liniový graf – Line chart
Koláčový graf (3D) – Pie char
Radarový graf – Radar chart
Bublinový graf – Bubble chart
Korelační graf – Scatter plot